Gold has a double top and failed signal with the bull-trap in May. It is in another downward channel here. I'm bearish on the price action. Some ticker are GLD GDXJ HMY EGO NEM TECK SAND NG
Longer term chart three years back
Showing posts with label Technical analysis. Show all posts
Showing posts with label Technical analysis. Show all posts
Wednesday, August 2, 2023
Saturday, July 8, 2023
Russell 2000 Index (IWM) Technical Analysis
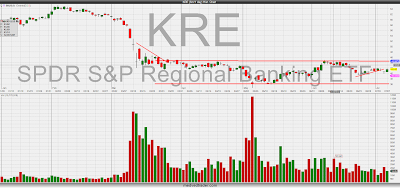
When you zoom out the chart lots of things become apparent. I drew up the major trading ranges the Russell 2000 IWM is in. These levels go back to last year. I see a high likelyhood of more short-term downside and level test from here. I drew up trend support too with the blue line. Trend support test is likely to be coming. So, I wouldn't be surprised to see a these levels touched. IWM once again is back in a trading range. There are a lot of small banks in this index and the Regional Bank ETF KRE has been weighing it down.
You can see KRE is in a trading range also. This isn't particularly bullish for the overall stock market going forward. The market has shown it can perform absent financials but the economy is to large extent small business.
You can see KRE is in a trading range also. This isn't particularly bullish for the overall stock market going forward. The market has shown it can perform absent financials but the economy is to large extent small business.
Subscribe to:
Comments (Atom)


