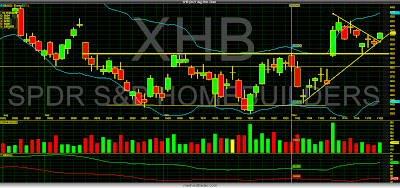
With an inverted yield curve going on for so long it is wise to be bearish on the economy from history. However, the bottom that was put in on the markets on October 13th continues to push higher even if it just grinds higher slightly day after day like this week.
Being bearish you would want to see a cyclical and consumer tied sector like home building show weakness. It's the exact opposite. This chart of the ETF XHB is very bullish right now. It retested the trading range which is the horizontal line and has trend support which is the diagonal line. The shorter line is the "bull" flag. It's going to take a major news or event to reverse this chart. It very well can happen and it's best to be opened minded but at this moment stocks look bullish. Even tech with QQQ is hanging around.


No comments:
Post a Comment