Welcome to my blog. Some of you may have come from 2+2 Forum. I am going to try to post more charts up going forward. I may even do a video blog or two on things I see and setups or trade recaps. It helps me too to analyze more charts. Here is a recent trade I made in Royal Carribean RCL. I was running nightly screens or "scans" as I call them for charts that haven't had a serious downtrend yet. I stumbled upon RCL the other day and saw a setup as a bear flag break. A bear flag is the opposite of a bull flag. It's just consolidation before the next push. I drew an "internal" trend line on the daily and shorted the breakdown and held through the retest up to $48 area as you see the green candle came back and failed to break through the line. Twice actually there two days in a row. Trend lines are never precise and an internal one captures the most points one is evident. The one I drew here is a little rough but showed the big picture. I made a good trade on RCL with weekly puts and sold on the gap down move. I think it has a lot more downside and may re-enter.
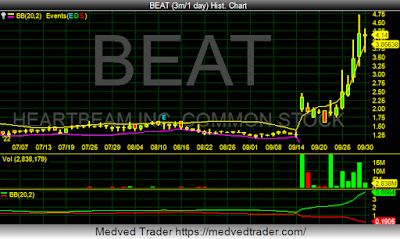
BEAT started to go red candle during the day above the upper bollinger band which is "the kiss of death". The candle has to print though and we didn't get it but usually these massive spikers that get far above upper bollie come down the next day. I shorted some and got stopped out. It will have a red day sooner or later. Maybe Monday. FNGR is a similar chart. FNGR keeps squeezing.


No comments:
Post a Comment